The Internet of Things has comprehensive perception capacity. Big data can fully tap and utilize the value of information. On this basis, it is to apply, evaluate and make decisions to serve the management and decision-making process. Cloud computing provides a new model for data storage. The establishment of a cloud platform connects the information, and completely realizes information resource sharing and system interconnection. Through the use of mobile Internet technology, the smooth transmission and exchange of information can be realized.

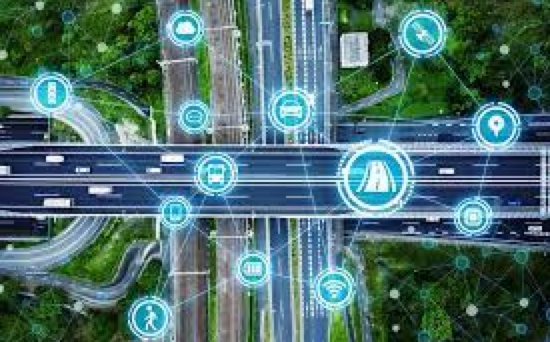
Smart bridge monitoring solution is to combine structural monitoring with technologies such as the Internet of Things, cloud computing and big data, so as to establish a complete online monitoring system to realize real-time monitoring of bridges.
The safety of bridges can be a complicated problem. For non-professionals, it is just a problem about breaking and connecting. For professionals, the problem is much more complex. Therefore, the safety of bridges is generally not directly named as a safety problem, but called a reliability problem.
To initiate a major transformation in bridge safety monitoring, we must change our thinking mode. We need three changes in thinking

1. To analyze all data related to bridge safety, instead of relying on a small number of data samples.
2. To accept the complexity of data, instead of pursuing accuracy. We should allow imprecision. The more complicated data, the better, and we need to achieve this in a standardized way.
3. We should no longer explore the causal relationship that is difficult to capture. Turn to the safety correlation. There is no need to focus on the causal relationship of bridge accidents in big data. Instead, we should look for the correlation between things, which will give us a very novel and valuable perspective.
The core of correlation is to quantify the mathematical relationship between two data. Strong correlation refers to an increase in data, and a corresponding increase in the value of another data. For example, Google predicted the trend of the flu. It is difficult for the global public health system to make statistics and judgments quickly, for there is often a delay of one to two weeks in obtaining and transmitting information. The CDC only summarizes it once a week, the lag of which can be lethal. And Google engineers published papers in Nature that shocked health officials and computer scientists, explaining why it is possible to quickly predict the spread of influenza in winter. By observing people’s search records on the Internet, Google is using entries associated with colds in huge data to predict that more people in the region will get flu. Weak correlation means that a data value increases, and the other data is almost unchanged. The core is to find a good correlation with the status and performance of the bridge. It can capture the present and predict the future.
With the continuous development of information and intelligence of bridges, the system of safety and health monitoring of bridge structure plays a vital role in the safe operation of bridges and prolonging the service life of bridges. Through the early detection and early warning of bridge diseases, the maintenance cost and maintenance cost of bridges can be greatly saved, and the heavy losses caused by frequent maintenance and traffic closure can be effectively avoided, especially for major bridge safety accidents.